CoreLogic® (NYSE: CLGX), a leading global property information, analytics and data-enabled solutions provider, today released the Home Equity Report for the first quarter of 2020. The report shows U.S. homeowners with mortgages (which account for roughly 63% of all properties) have seen their equity increase by 6.5% year over year, representing a gain of $590 billion since the first quarter of 2019.
This press release features multimedia. View the full release here: https://www.businesswire.com/news/home/20200611005168/en/
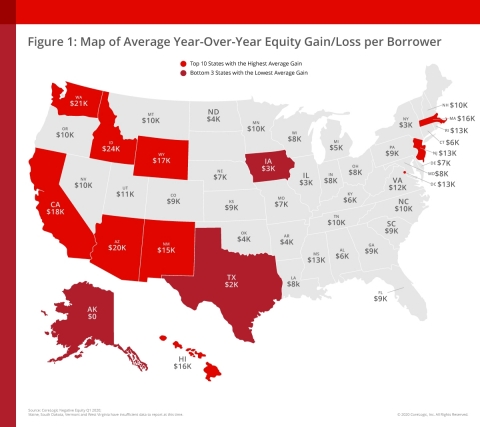
CoreLogic Map of Average Year-over-Year Equity Gain/Loss per Borrower (Graphic: Business Wire)
In the latter half of the first quarter of 2020, the coronavirus (COVID-19) began to spread across the country, with immediate economic impact not fully realized until the end of March. As the pandemic continued to unfold and shelter-in-place orders were extended, unemployment reached double digits within a few short weeks and left many homeowners scrambling to cover mortgage payments. However, home prices continued to rise, which added to borrower equity through March.
Negative equity, also referred to as underwater or upside down, applies to borrowers who owe more on their mortgages than their homes are worth. From the fourth quarter of 2019 to the first quarter of 2020, the total number of mortgaged homes in negative equity decreased by 3.1% to 1.8 million homes or 3.4% of all mortgaged properties. The number of mortgaged properties in negative equity in the first quarter of 2020 fell by 16%, compared to the first quarter of 2019, when 2.2 million homes, or 4.1% of all mortgaged properties, were in negative equity. Because home equity is affected by home price changes, the number of borrowers with equity positions near (+/-5%) the negative equity cutoff is most likely to move out of or into negative equity as prices change. Looking at the first quarter of 2020 book of mortgages, if home prices increase by 5%, 310,000 homes would regain equity, and if home prices decline by 5%, 420,000 would fall underwater.
Homeowners gained an average of $9,300 in home equity between the first quarter of 2019 and the first quarter of 2020. States with the largest gains include Idaho, where homeowners gained an average of $24,400, Washington, where homeowners gained an average of $20,800 and Arizona, where homeowners gained an average of $19,900.
The national aggregate value of negative equity was approximately $284 billion at the end of the first quarter of 2020. This is down quarter over quarter by approximately $1.9 billion, or 0.7%, from $286 billion in the fourth quarter of 2019 and down year over year by approximately $22.6 billion, or 7.4%, from $307 billion in the first quarter of 2019.
“The pandemic recession will likely lead to price declines in many areas during the next year and weaken home equity gains,” said Dr. Frank Nothaft, chief economist for CoreLogic. “However, price declines will be far less than those experienced during the Great Recession, when the national CoreLogic Home Price Index fell 33% peak-to-trough. Our latest forecast shows the national index to have a peak-to-trough decline of 1.5%.”
Over the past 10 years, the equity position of homeowners has positively changed as a result of more than eight years of rising home prices. As the economy climbed out of the recession in the first quarter of 2010, 25.9% or 12.1 million homes were still underwater, compared to the first quarter of 2020 when the negative equity share was at 3.4%, or 1.8 million properties. Borrowers have seen an aggregate increase of $6.2 trillion in home equity since the first quarter of 2010 and the average homeowner has gained about $106,100 in equity. Every state experienced a large reduction in the share of homes in negative equity, with Nevada posting the most significant drop in negative equity share, falling 70 percentage points between the first quarter of 2010 to the first quarter of 2020.
“Many homeowners will experience a recession during their lifetime, and it is reasonable to compare the current recession to those in the past,” said Frank Martell, president and CEO of CoreLogic. “But the comparison is not apples to apples — every recession is different. Primary drivers of the Great Recession were an overbuilt housing stock, risky mortgages and the collapse of home prices, creating a massive increase in negative equity that proved difficult to recover from. Today’s housing environment has low vacancy and delinquency rates and a large home equity cushion. While the CoreLogic HPI forecasts a decline in home prices in the coming year, we can also expect the majority of homeowners to remain above water.”
For ongoing housing trends and data, visit the CoreLogic Insights Blog: www.corelogic.com/insights-index.aspx.
Methodology
The amount of equity for each property is determined by comparing the estimated current value of the property against the mortgage debt outstanding (MDO). If the MDO is greater than the estimated value, then the property is determined to be in a negative equity position. If the estimated value is greater than the MDO, then the property is determined to be in a positive equity position. The data is first generated at the property level and aggregated to higher levels of geography. CoreLogic data includes more than 50 million properties with a mortgage, which accounts for more than 95% of all mortgages in the U.S. CoreLogic uses public record data as the source of the MDO, which includes both first-mortgage liens and second liens, and is adjusted for amortization and home equity utilization in order to capture the true level of MDO for each property. The calculations are not based on sampling, but rather on the full data set to avoid potential adverse selection due to sampling. The current value of the property is estimated using a suite of proprietary CoreLogic valuation techniques, including valuation models and the CoreLogic Home Price Index (HPI). Only data for mortgaged residential properties that have a current estimated value are included. There are several states or jurisdictions where the public record, current value or mortgage data coverage is thin and have been excluded from the analysis. These instances account for fewer than 5% of the total U.S. population. The percentage of homeowners with a mortgage is from the 2018 American Community Survey. Fourth quarter of 2019 data was revised. Revisions with public records data are standard, and to ensure accuracy, CoreLogic incorporates the newly released public data to provide updated results.
Source: CoreLogic
The data provided is for use only by the primary recipient or the primary recipient’s publication or broadcast. This data may not be re-sold, republished or licensed to any other source, including publications and sources owned by the primary recipient’s parent company without prior written permission from CoreLogic. Any CoreLogic data used for publication or broadcast, in whole or in part, must be sourced as coming from CoreLogic, a data and analytics company. For use with broadcast or web content, the citation must directly accompany first reference of the data. If the data is illustrated with maps, charts, graphs or other visual elements, the CoreLogic logo must be included on screen or website. For questions, analysis or interpretation of the data, contact Allyse Sanchez at corelogic@ink-co.com. Data provided may not be modified without the prior written permission of CoreLogic. Do not use the data in any unlawful manner. This data is compiled from public records, contributory databases and proprietary analytics, and its accuracy depends upon these sources.
About CoreLogic
CoreLogic (NYSE: CLGX), the leading provider of property insights and solutions, promotes a healthy housing market and thriving communities. Through its enhanced property data solutions, services and technologies, CoreLogic enables real estate professionals, financial institutions, insurance carriers, government agencies and other housing market participants to help millions of people find, acquire and protect their homes. For more information, please visit www.corelogic.com.
CORELOGIC and the CoreLogic logo are trademarks of CoreLogic, Inc. and/or its subsidiaries. All other trademarks are the property of their respective owners.

View source version on businesswire.com: https://www.businesswire.com/news/home/20200611005168/en/