Panthers v Broncos: Who Will Win Super Bowl 50?

Partha Sen, co-founder of Fuzzy Logix, has crunched the numbers and analysed a whole lot of data to predict who will win the Super Bowl
Even though my Green Bay Packers are not in Super Bowl 50, I do feel proud of the fact that ‘Carolina Panthers’, the team from my city ‘Charlotte, North Carolina’ is in Super Bowl. This will be the second trip to Super Bowl for the Carolina Panthers. In 2004, they lost to the New England Patriots by a field goal in the dying minutes of the game.
For the last few years, a few friends have been telling me to forecast who will win Super Bowl based on statistical analysis. I have always thought that such an exercise is futile because the teams that make it to playoffs and Super Bowl are playing their best football and, what separates them on game day is better execution favored by pure luck. In other words, I have always thought that the outcome of playoffs and Super Bowl is purely random and therefore, difficult to predict.
Nonetheless, after being requested by some friends repeatedly,I was motivated to perform some statistical analysis and at least see if the outcome of playoffs and Super Bowl is really random.
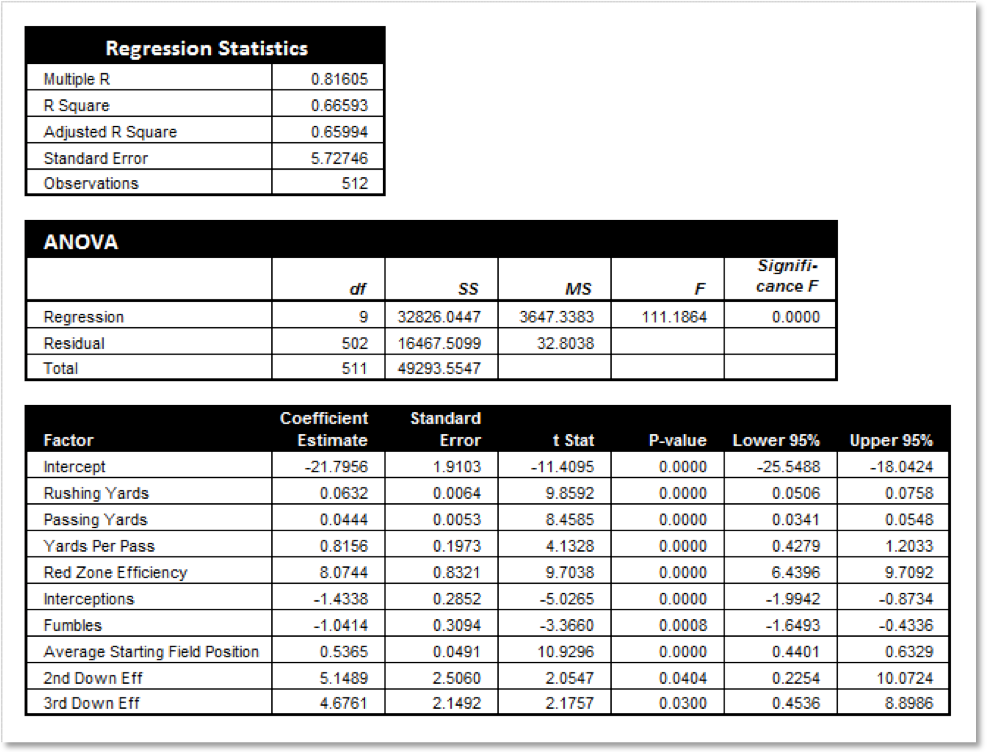
I took play by play data for all the regular season games for 2015 and analyzed more than a 500 factors. The data was obtained from www.nfl.com and www.armchairanalysis.com. The objective of this analysis was to identify factors that can predict the number of points scored by a team. Once these factors were identified, I built a multi-factor linear regression model to predict the points scored by a team (see Exhibit A for the specifications of the model).
Here are a few noteworthy points about this model:
• The predictive power of this model is reasonably high. In statistical terms, the R-Squared is 67 percent which negates the assumption that parity in NFL implies the outcome of games is random and unpredictable. Also, all the factors are significant at five percent level.
• The factors in the model are intuitive. Also, the factors give weightage to offense, defense and special teams. The contribution of defense is measured by interceptions and fumbles effected by the opposing team. Please notice that the coefficient estimate for interceptions and fumbles are negative which means that for each interception or fumble the points predicted for the team decrease.
• Average starting field position is an attribute that measures the efficiency of special teams and finds place in the model.
Now, the important question is for how many regular season and playoff games was this model able to predict the outcome correctly. Well, the model correctly predicted the outcome of 219 games out of a total of 256 regular season games. That is an accuracy of 86 percent. Again, in NFL, which Al Michaels once termed as ‘Not Figured-Out League’, such accuracy should be considered as impressive. For the playoffs, the results were even better. The model was able to predict the outcome of every game correctly. In a number of cases, the actual points scored were exactly what the model predicted or very close to it (see Exhibit B) below.

Predictions for Super Bowl 50:
In order to predict the winner of Super Bowl 50, I collected data for the 9 factors in the model for both the teams. The data was were collected for 18 games played by both the teams in the 2015 season. The averages for these factors as well as the variability were analyzed. The variability is important in making a prediction like this. Let me explain with an example. On an average the Carolina Panthers have 145 rushing yards per game but, the standard deviation is 25 yards. This means that on game day, we could expect some variance from the average and that could have some impact on the points scored. One could attribute such variance to randomness or pure luck.
Based on the averages and the standard deviations of these 9 factors, I simulated the outcome of the Super Bowl 50. Such simulation was performed 10,000 times and the points scored by each team were predicted based on the model outlined in Exhibit A.
Well, based on these simulations and statistical analysis, here are my predictions:
• The Carolina Panthers have a 77 percent chance of winning Super Bowl 50.
 • The expected score is Carolina Panthers 27, Denver Broncos 20. However, there is a significant probability that the Carolina Panthers could outscore the Denver Broncos by two touchdowns.
At the time of Super Bowl, I will on a flight in India and will probably miss a good part of it. As soon as I land, I will turn on my cell phone and get updates. Once the game is over, I will collect the statistics and perform some post-mortem on the model to see if it holds up. Till then, ciao!
How much do you know about data analytics? Try our quiz!